LS-111P CO2 Air Quality Sensor
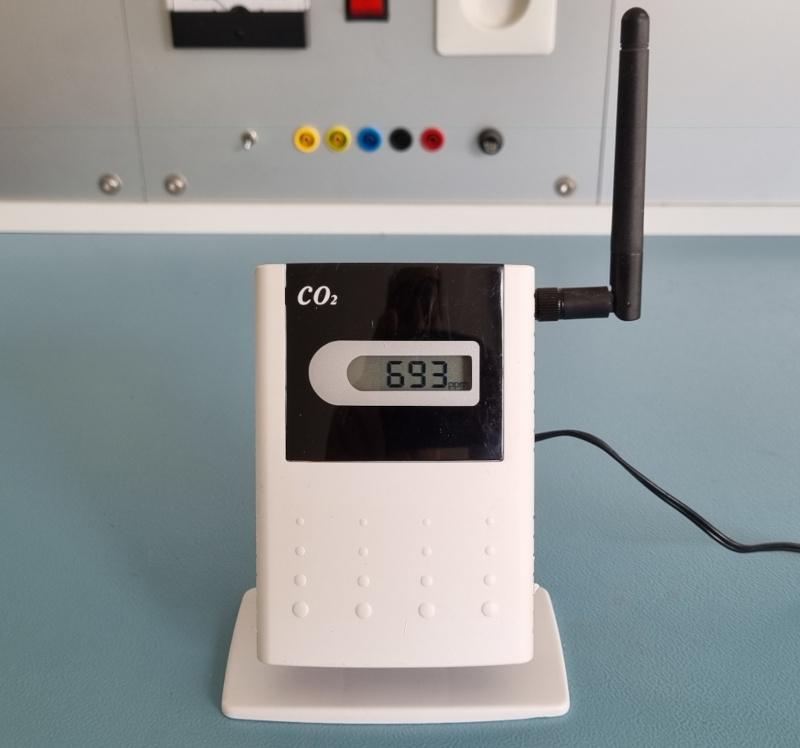
A friend of mine saved a whole bunch of these sensors from the scrap heap.
They originated from a school which wasn't interested in a previous air quality project any more.
And since we're both a member of the WIS club (Weggooien Is Sund, a Dutch dialect which can be translated as Wasting Is a Shame), he donated a few to me.
Nobody of us knew exactly what these things were.
There was no type number to be found on the outside nor on the inside, which made it difficult to find more information about the devices.
We knew they were CO2 sensors, presumably with a LoRa transmitter.
Potentially this could turn into a nice project for ourselves.
However without some additional information it was impossible to connect these things to TheThingsNetwork.
Spoiler alert: I did manage to connect the LP-111P to TheThingsNetwork (from now on abbreviated to TTN). So read on, or skip ahead, if you want to know how to connect the LP-111P to TheThingsNetwork, uhhhh TTN.
Let's Take It Apart
As Dave Jones, from the eevblog, is used to say: "Don't turn it on. Take it apart." This revealed some interesting parts which potentially could be used for my own projects, if I'll ever find the time to play with those parts that is.
The CO2 Sensor
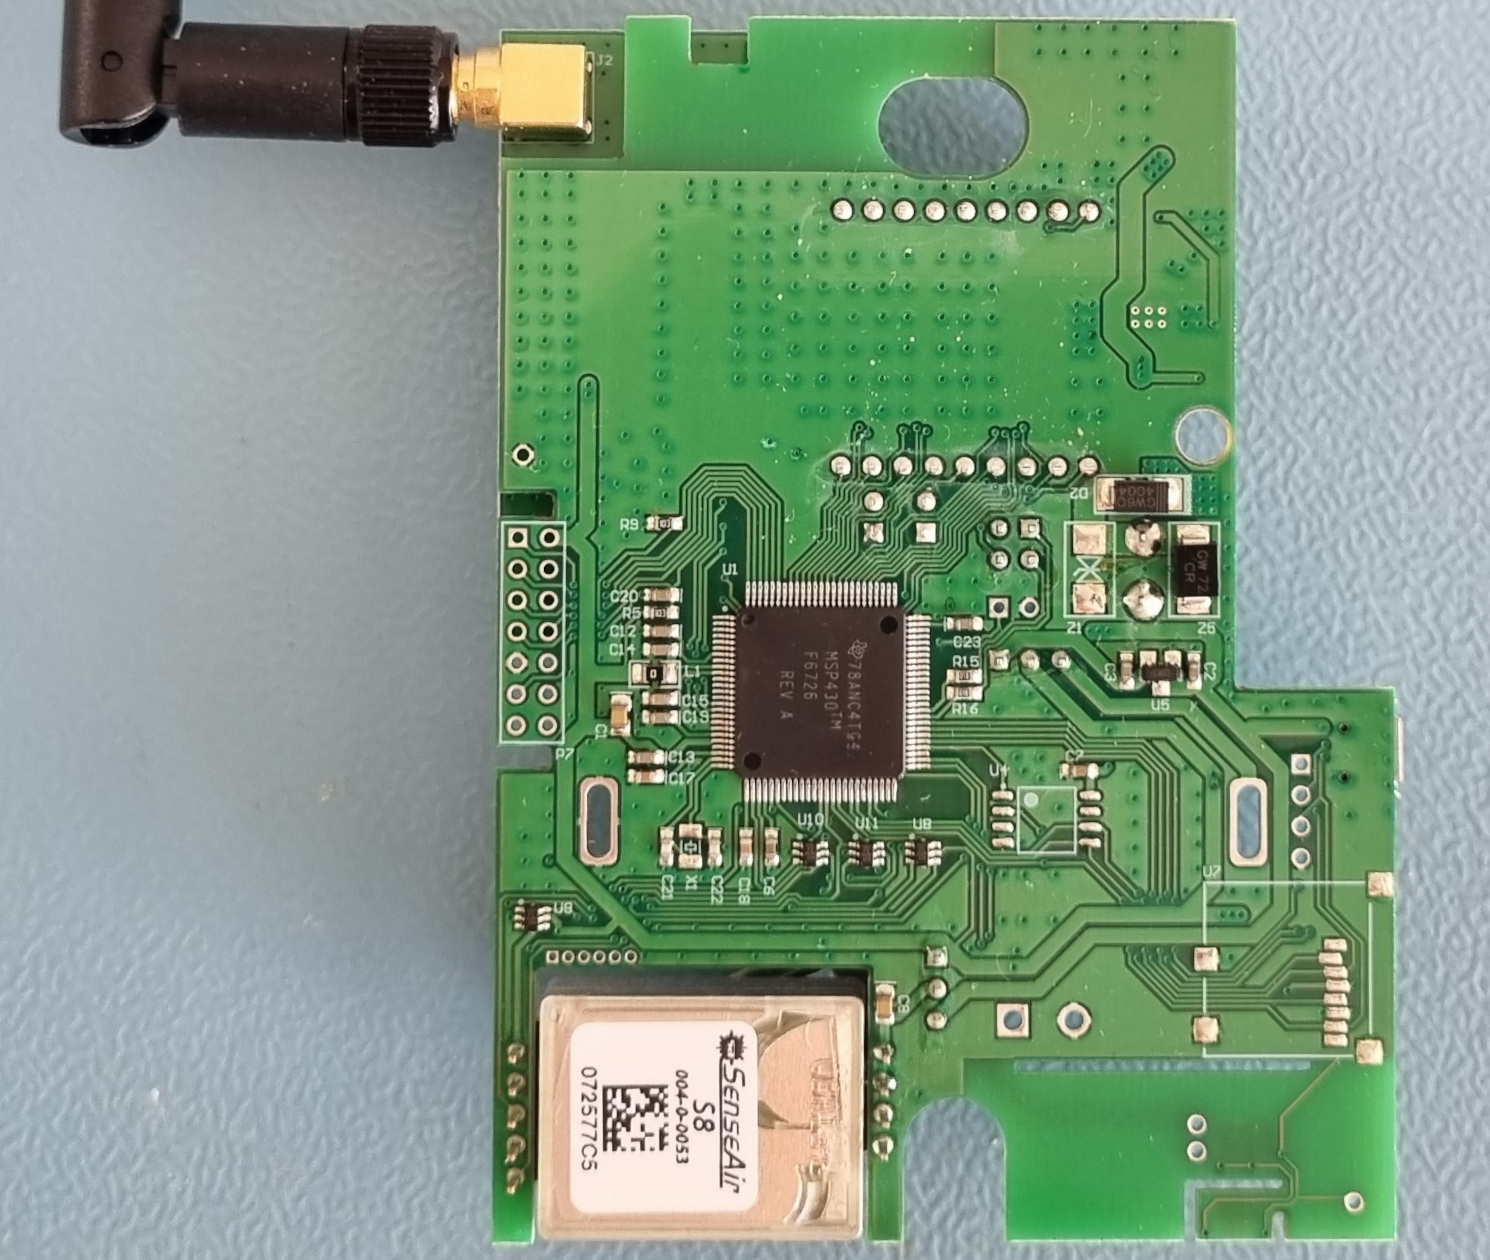
The CO2 sensor is a self contained module with the name SenseAir S8.
Plans quickly arose to connect this module to an ESP32 or Raspberry Pi Pico W and build my own CO2 sensor.
Let's see if I can find some information about this thing on the interwebs.
This took me to the SenseAir web site where you can find all the information about the CO2 module.
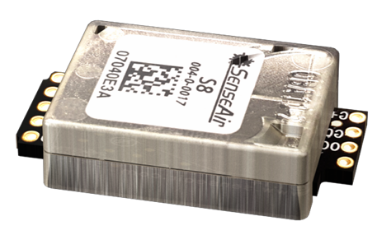 It appears it uses a simple serial communication.
The only disadvantage is that it uses the MODBUS protocol, which unnecessarily complicates communication with the module, to my humble opinion.
Why can't the module simply reply with the measured value when asked for it?
Anyway, soon I desoldered a module from one of the device and started tinkering with it using a Raspberry Pi for communication.
The next WIS club meeting I was able to demonstrate an MQTT enabled CO2 monitor prototype, based on a Raspberry Pi.
Warning: The SenseAir documentation explains that the sensor is a very sensitive device, which should be handled carefully.
Do not pinch, dent, or warp the case for instance.
This may affect the alignment of the internal components.
And you should not touch the air openings with your fingers, this may contaminate the sensor.
Anyway, I read these warnings after manhandling the sensor by desoldering it from the PCB.
The result was that the sensor took several weeks to recover and show similar results to the ones that I hadn't abused yet.
The LCD, CPU And Temperature/Himidity Sensor
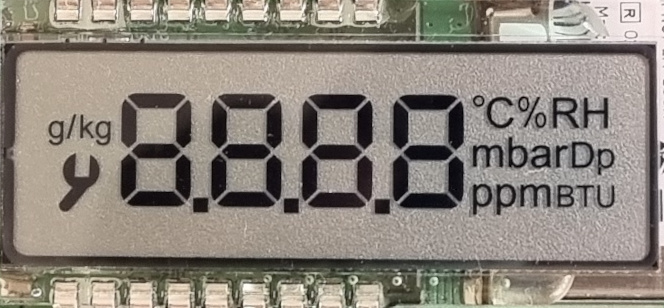 Nice sharp contrast. A pitty it is has no backlight.
What more can we potentially use of this machine?
The LCD module is nice, but it requires a multiplexed connection, which restricts the choice of microcontroller.
With plenty of alternative LCD modules available with more suitable interfaces I doubt I will be using this display for one of my projects any time soon.
Speaking about interfacing the LCD.
The CPU on this PCB can do that, obviously.
It's a MSP430 from Texas Instruments.
I've always been fascinated by these low power devices.
However there are many other, more suitable, processors to choose from nowadays.
The temperature/humidity sensor is a SHT30 from Sensirion.
It's an I2C device.
That could make a nice sensor, even though they are quite affordable nowadays.
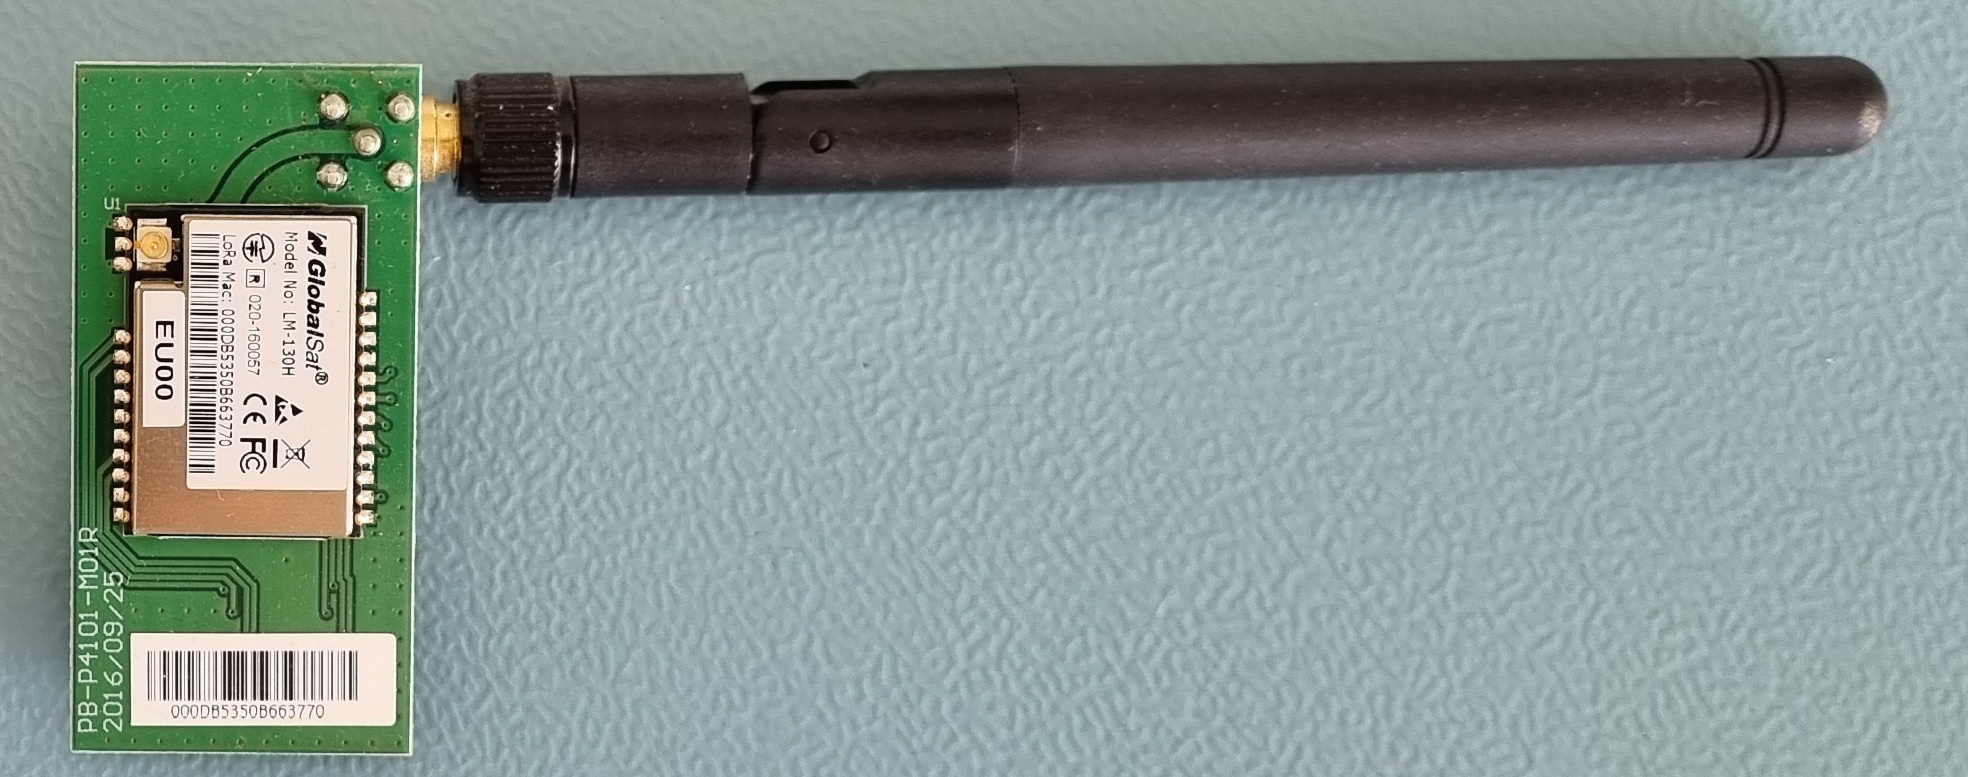 The LoRa module LM-130H. Click to enlarge.
Apart from the voltage converter there's only one component left which might be used for my own projects, the LoRa module.
Let's see what we can find on the interwebs when we look for LM-130H.
This took me to GlobalSat's website.
And what do you know, on their website was a picture of what looked a lot like three of my devices!
It appears that apart from the LS-111P they have 2 more similarly looking devices, the LS-112, which has a CO monitor instead of a CO2 monitor, and the LS-113, which has a PM2.5 monitor.
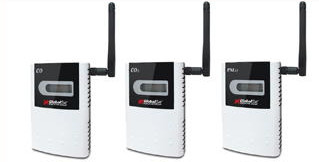 I don't think I have found enough information about the LoRa module in order to be able to communicate with it.
But I soon lost interest in the LoRa module itself.
It is nice to build a device which can be used anywhere, but there are some limitations to LoRa.
LoRa coverage is not good enough to use the device anywhere you want, and you'll have to adhere to rate limit restrictions.
Limitations you don't have if you use WiFi to connect your sensors.
It's cheaper to setup a WiFi network than it is to build a LoRa network.
But what I did find was enough information to connect the LS-111P to TTN!
So let's do that. I still intend to build my own CO2 monitoring device though.
But now I can use these monitors, while I can do other projects first.
So much to do, so little time to do it.
Little Annoyances
Before I'm going to explain how to connect the LP-111P to TTN (which is what you here for, I guess), I'm going to write about a few little annoyances which I've found when I actually started using these air quality monitors.
One of the little annoyances of these devices is the fact that the display is not lit, which makes it very difficult to read the values directly on the devices, especially in the evening.
And the Yellow and Red indicator LEDs, which light up when the CO2 level exceeds a certain threshold, are not very bright either.
This may be annoying, but it can also be a positive thing.
I want to put these devices in some inconspicuous places in my house, so I don't want them to light up like a christmas tree.
By the way, there are two jumpers inside the device which can be used to disable the LEDs altogether if you want to.
Whereas the alarm LEDs are rather dim, the same can't be said for the 3 status lights on the side of the device. These LEDs shine through slits in the side of the case and are very bright and very flashy. Since I have no clue what these lights mean I might as well turn them off. There are no jumpers to do that. Simply removing the 100 Ω series resistors will do the trick.
Another thing which annoys me is the way the values are presented to you on the display. Temperature, humidity and the CO2 levels are individually shown for 5 seconds each. I can agree with that. After all there are 3 different values to be shown and the display can only show one value at a time. What does annoy me though is that a value can change on the display during each 5 second interval. This triggers you to think that the next property is displayed, while in fact it is a different value of the same property. It would have been better if they would have frozen the update of the value during the entire 5 second interval.
And the final one is the biggest annoyance of them all, if you ask me.
And that is the squeaky power supply.
It's just like a high pitched two tone siren.
OK, at my age it is not that loud any more, but youngsters can hear it very clearly.
And I don't know what your dog will think of the noise the power supply makes.
I'll explain why you can hear the power supply so clearly, and what you can do to avoid it in the next chapter.
The Power Supply
The device can be powered by a 5V phone charger through its micro USB connector on the left side. The average current consumption is < 100mA, with some occasional short spikes in excess of 300 mA, possibly caused by the CO2 sensor and/or the LoRa module.
Another way to power the devices is by connecting a DC voltage between 8V and 24V to the internal screw terminals. My device came powered this way. I hate it though when a device has a non detachable power cord. On top of that the power cord was fed through the back of the device in a very amaturistic way, with a knot as a strain relief.
So I'm going to power mine through the micro USB connector, that's for sure. Wait a minute, when I do that I don't hear the power supply squeaking any more! Let's see what is happening.
 When powered by the micro USB port the switching frequency is too high to be audible
As you can see in the scope picture above the switched mode power supply operates at a relative constant frequency of some 700 kHz when powered through the micro USB port. It is impossible to hear that frequency, not even for dogs.
 When powered from the screw terminal the power supply runs in interrupt mode, switching between 7.3kHz and 10kHz, depending on the load.
But when I power the device from the screw terminal input the picture looks very much different. The power supply now operates in an interrupt mode. A short burst of the 700 kHz signal is output and then it stops. Probably until the output voltage drops too low and then the oscillator is started again. The interval between these bursts apparently depends on the current load. And this interval results in a frequency low enough to be audible again.
Now I know for certain that I'm going to power the devices through a phone charger!
Configuring The LS-111P
Before we can connect the LS-111P to the TTN we need to know how to configure it. We need to be able to extract some information from it and we need to be able to write a key to the device. This can all be done using the serial port.
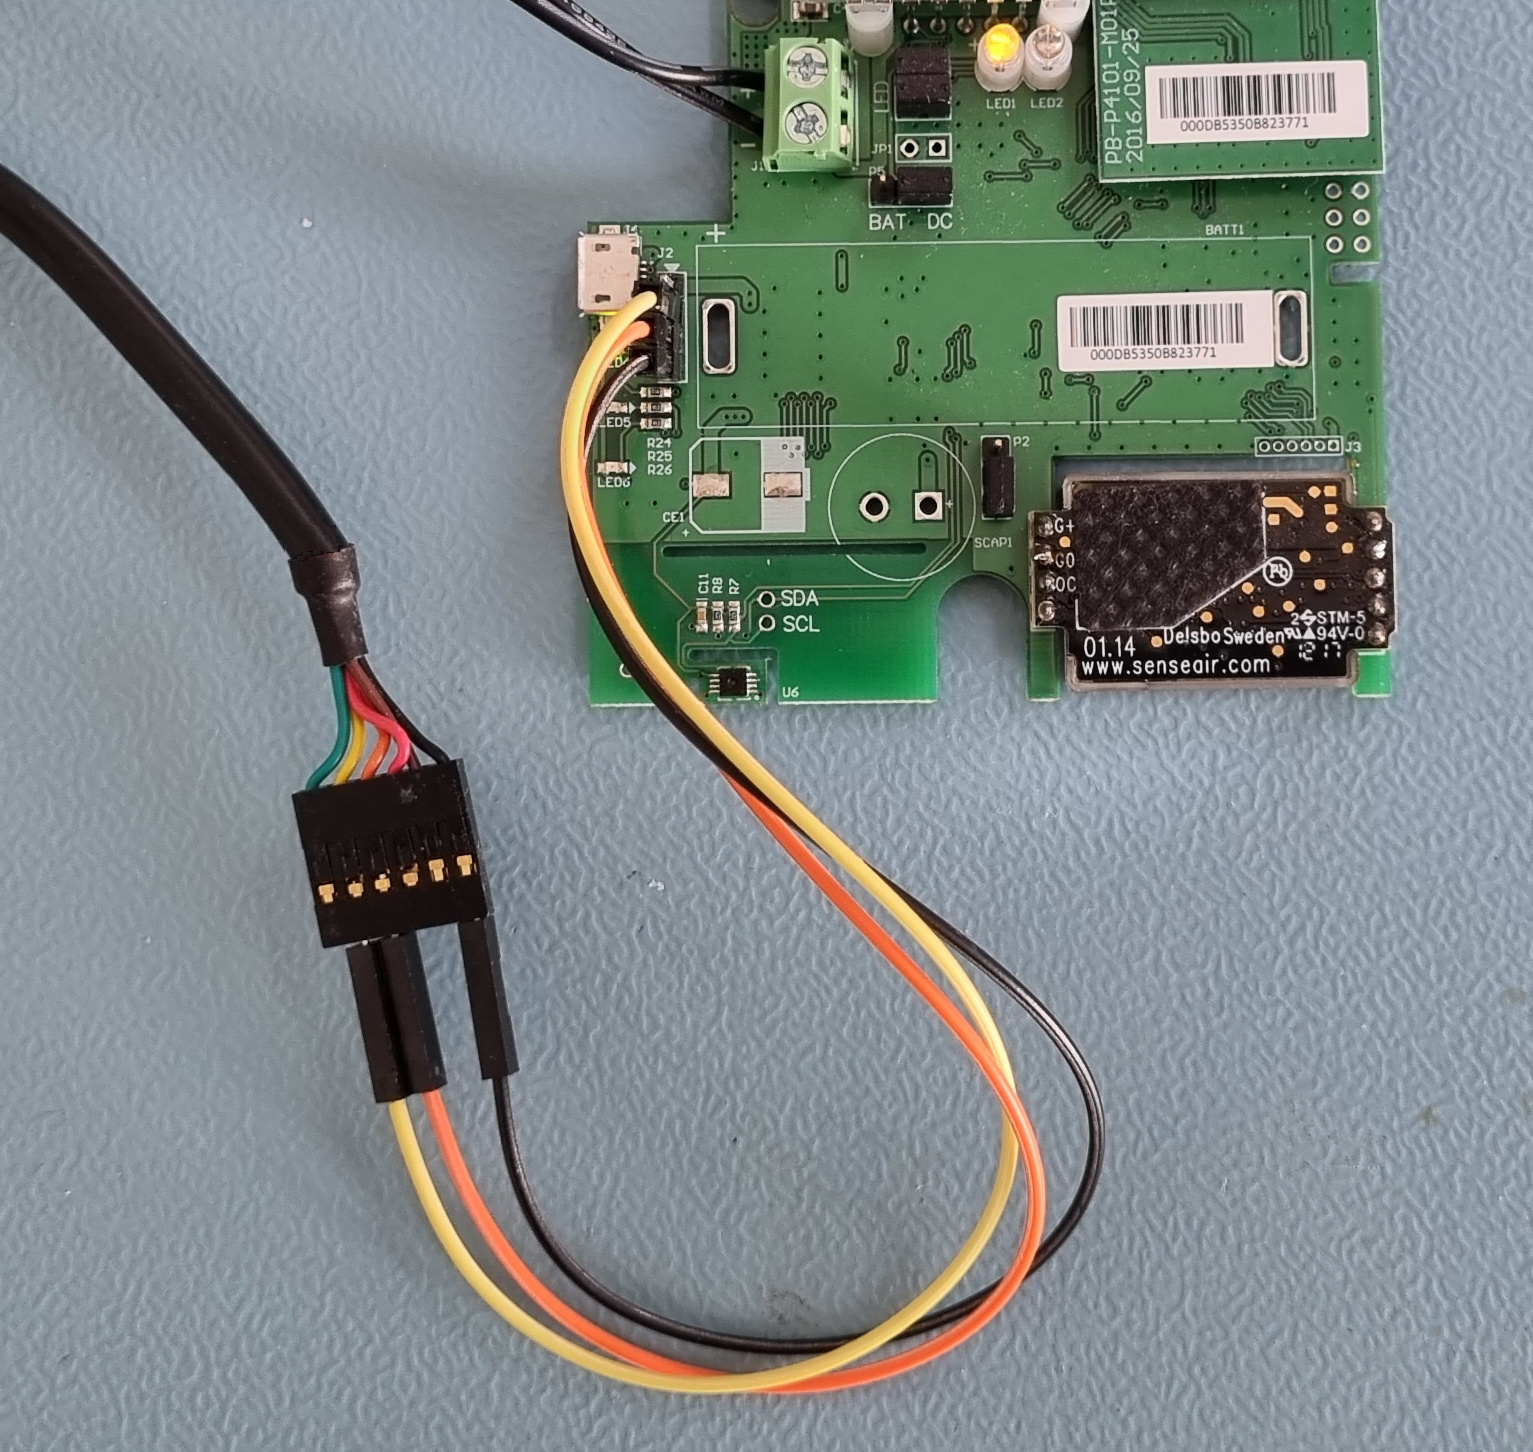
I use an FTDI cable to communicate with the device.
This is a cable with a USB connector on one side and a header connector on the other.
Important to note is that you'll need a cable which is configured to work with 3V3 signal levels.
Any other USB to serial converter can be used though, as long as the signal levels are 3V3.
You can access the serial port in two different ways.
When you open the device you'll see a row of 4 holes just to the right of the micro USB connector.
The text CONFIG gives away the function of those holes.
Pin 1, the one with the triangle pointing down to it, is a +3V3 output.
This may be used to power your serial adapter if necessary.
It is not to be used as power input though.
Power should be applied to the micro USB connector (5V) or the green screw terminal (8V to 24V).
Pin 2 is the TxD line, which is to be connected to the RxD line of your serial converter.
On the FTDI cable this is the yellow wire.
Pin 3 is the RxD line, which is to be connected to the TxD line of year serial converter.
On the FTDI cable this is the orange wire.
Pin 4 is GND, which is to be connected to the GND pin of your serial converter.
On the FTDI cable this is the black wire.
Alternatively you can build a USB to serial cable, which ends in a micro USB connector. The LS-111P has the serial wires connected to the micro USB connector too. This is non standard of course, but it may help you if you need to configure a massive load of devices, without the need to open them all up. Pin 2 of the micro USB port is the PCB's TxD line, and pin 3 is the RxD line. Pin 1 is the +5V input, while pins 4 and 5 are both GND.
I personally simply soldered a 4-pin header to the PCB and connected some Dupont wires between my FTDI cable and the PCB. After all, this is only a one time operation. After configuration it is not likely that you'll have to configure the device ever again.
I have found this document, describing the AT commands, on the interwebs explaining how to communicate with the device.
However, the device is a bit picky on the communication format, which made communicating with it a bit more challenging.
Make sure the communication settings of your terminal program are set to 57600 bps, 8 bits, no parity and 1 stop bit. All quite standard, apart from the less common bit rate.
According to the AT Commands document communication is done through AT commands, duh.
I have quite some experience in communicating with AT commands.
And the reason why they are called AT commands is that every command should begin with AT+.
This appeared to be a wrong assumption.
The commands in the document are exactly the commands which should be given.
No AT+ in front of them is required or accepted.
And the document clearly states that every command should be terminated by a CR/LF pair.
I'm using minicom as a terminal program, and it appears that minicom is not configurable to do just that.
It can be configured to use CR and LF at the end of each line, but probably it outputs LF/CR instead of CR/LF.
I was able to listen to what the device had to say.
But there was no way I could make the device listen to me.
Is there perhaps a jumper, prohibiting serial communication or something like that?
Apparently not.
Then I tried Putty, a very commonly used serial terminal program for Windows.
It is also available on Linux, so I installed that.
With the same result.
The device simply did not listen to what I had to say.
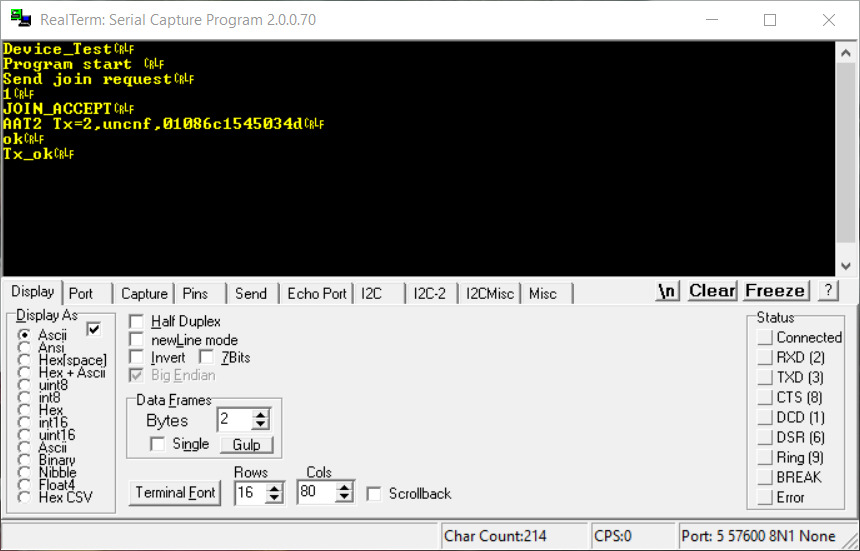
The AT Commands document starts with the suggestion to use RealTerm as terminal program though.
And with good reasons, it appears.
I took a Windows machine, installed RealTterm, and without configuring anything I was able to talk to the device.
So if you're a Windows user, simply install RealTerm and ignore the ugly user interface of that program.
It works, and that's what is most important.
For Linux users, who can not run RealTerm there is a workaround.
You can basically use any terminal program you like (my preference is minicom), as long as you don't terminate your commands using the ENTER key.
Instead terminate your commands with Ctrl-M Ctrl-J.
So, type your command, and then press Ctrl-M and Ctrl-J.
For example:
DEV+DTX_STATE? Ctrl-M Ctrl-J
Commands are case sensitive.
So it's best to copy the commands from the AT Commands document and paste them into your terminal program and terminate them with Ctrl-M and Ctrl-J.
And do not type spaces between the command and the Ctrl keys.
The example above only uses spaces for readability.
It may happen that some garbage is already available in the device's input buffer. That may trigger an "unknown command" error to be replied by the device. Simply repeat the command if that happens.
There are two groups of commands.
Commands starting with the word DEV will take effect immediately.
While commands starting with the word AAT must be saved manually, otherwise they may not survive a power cycle.
Saving is done by sending the AAT1 Save command.
That saves all your settings, but it does not make them effective yet.
For that you'll have to restart the device or send the command AAT1 Reset first.
Armed with this knowledge we can start configuring the device for TTN.
But let's take one advice from the AT Commands document to heart first.
I don't know if it is important, but let's do it anyway.
According to the AT Commands document we need to stop the transmission for the sensor node (whatever that may mean).
This is done by sending the command DEV+DTX_STOP, the device should reply with "data_tx_stopped".
Don't forget to send the command DEV+DTX_START when you're done with your configuration.
Joining TheThingsNetwork
First of all let me warn you that I cannot guarantee you a successful connection to the TTN network.
Even if you do everything right, success also depends on the availability of TTN coverage at the location where you want to deploy your monitors.
If there is no gateway within reach of your monitor, communication to TTN is not possible.
Unless you deploy your own TTN gateway of course.
The TTNmapper web site features a coverage map which might give you an indication whether there is coverage at your location or not.
Bear in mind that the TTN is run by volunteers, with the associated varying gateway capabilities, footprints and uptimes.

So, with that out of the way, go to TTN and login, or create a new account if you haven't got one already.
Once logged in go to your console. There are several ways to get there, however I have not found a consistent way. Anyway, you'll know when you're there.
You may have to select a region at some point.
It's best to choose the region suggested by TTN, which is probably closest to you.
We're here to add our sensor, so let's click on the "Go to applications" tile in the TTN console.

Let's assume this is your first application you're going to configure, which explains why the applications list is still empty.
If not you probably already know how to proceed.
Click on the "+ Add application" button which takes us to the following page.
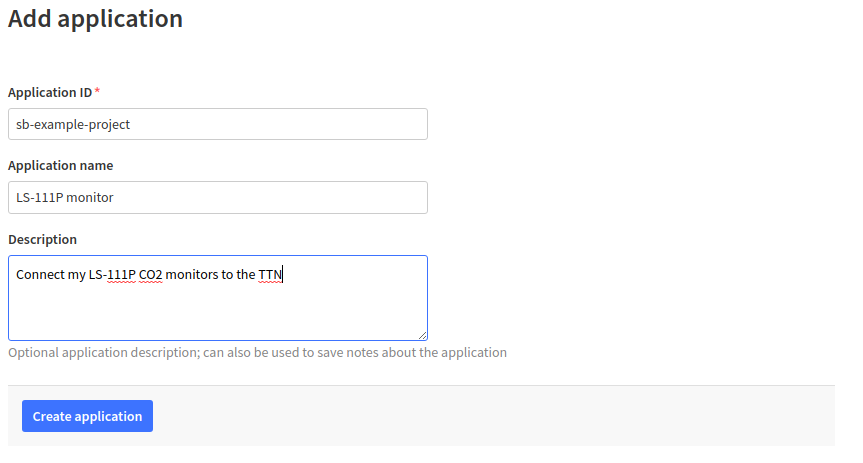
The most difficult part of this form is to come up with a unique Application ID.
Simply calling that "sensor" will not work because someone else already claimed that ID.
It doesn't matter what you enter here though, as long as it is a unique identifier.
You're free to select any Application Name you want. And the Description field can contain anything, it may even remain empty.
Clicking on the "Create application" button will bring you to the following page.
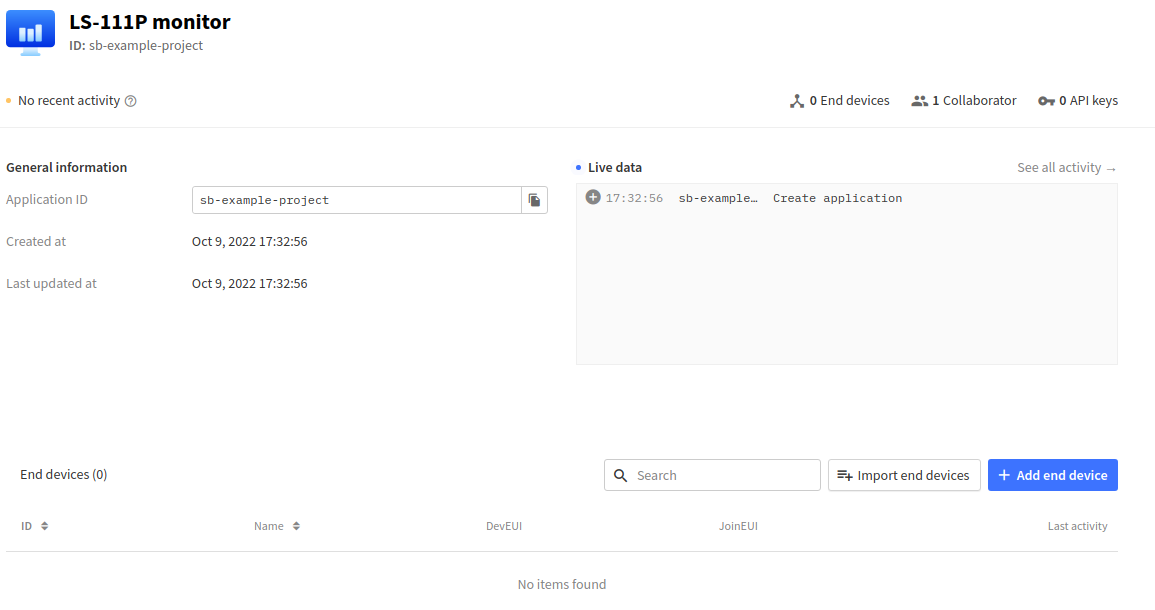
Click the "Add end device" button to get to the following page.
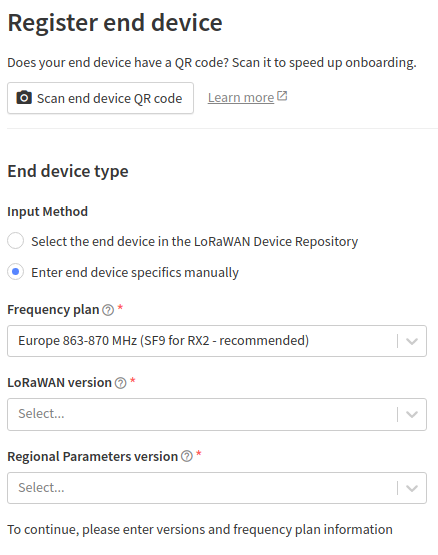
We do not have a QR code and our device is not to be found among the known device manufacturers, so we need to select the "Enter end device specifics manually" option.
That will reveal 3 more input fields.
The first field may be challenging for you when you do not live in Europe.
You'll need to find the option which applies best to your location.
There are a lot of options to choose from.
I simply went for the recommended option for Europe.
I have no idea what to enter in the second field.
I simply chose the first option.
And as soon as you do the number of input fields changes again.
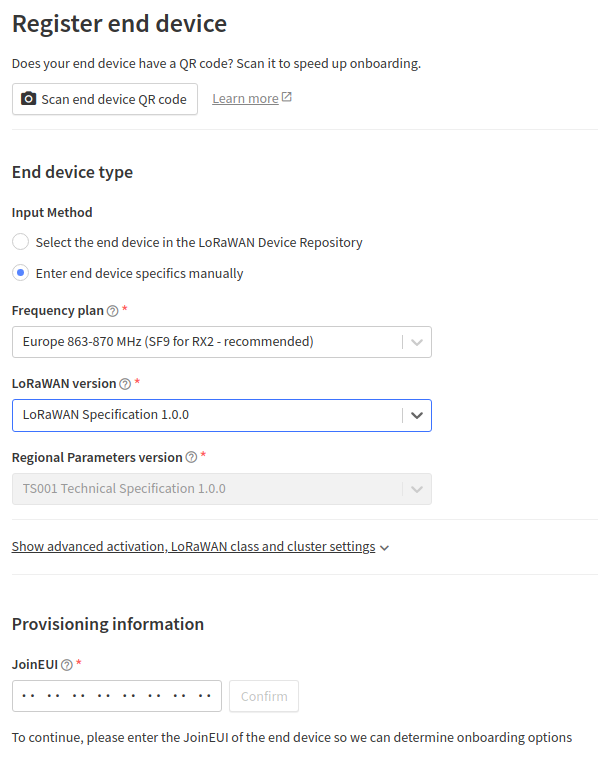
You can ignore the advanced settings fold out line here.
There are no advanced settings to change.
The most important new field is the DEVEUI field.
We need to get this value from the device itself.
Make sure your CO2 monitor is powered and connected through the serial adapter of your computer.
There's no telling what your device has been through, so let's start by restoring the defaults.
In the terminal enter the command AAT1 Restore.
After a short delay the device will reply with:
ok
program start
Now we need to stop the transmission for the sensor node by applying the DEV+DTX_STOP command. This is replied with:
data_tx_stopped
Because we've reset everything to the default modes we need to set the JoinMode to OTAA again. This is done with the AAT2 JoinMode=1 command. The device should reply with:
ok
Finally we can enter the command AAT2 AppEui=? . The device will then respond with something like this:
000000000010203
That's what we're after.
So let's enter that on the TTN web page.
Then click on the "Confirm" button which will appear next to the DEVEUI field.
This again adds some new input fields, which are shown below.
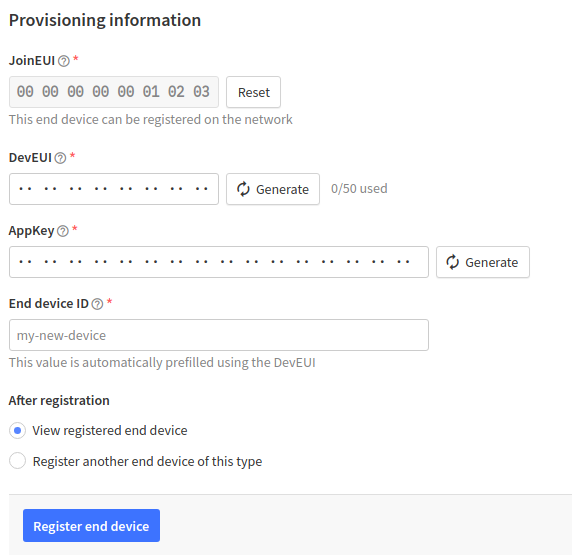
In the terminal enter the command AAT2 DevEui=? and the device will respond with something like this:
000D003500660070
Copy this value to the "DevEUI" field on the TTN web page.
Warning! Do NOT click on the "Generate" button next to the DevEUI field, because that will generate a different DevEUI and paring will fail miserably.
Then click on the "Generate" button next to the "AppKey" field.
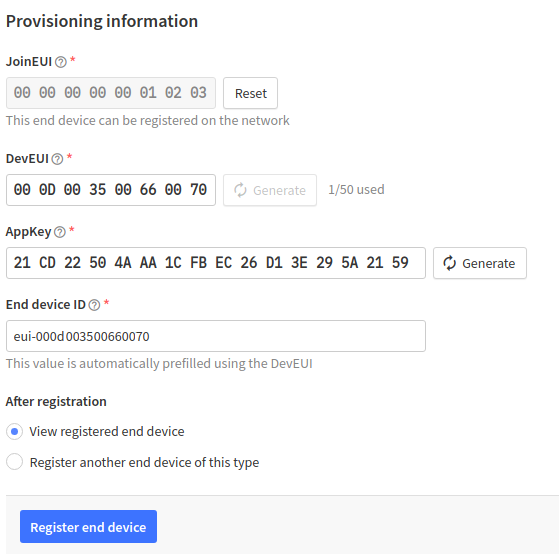
Now it's time to write the AppKey to the device. In our case it's done by giving the AAT2 AppKey=21CD22504AAA1CFBEC26D13E295A2159 command. Needless to say that you'll have to replace the key in this command with your own AppKey, I hope. The device should reply with:
ok
This basically completes the join mode.
We've entered everything we need.
A default End Device ID is suggested by TTN.
You can change that value into anything that identifies that particular end device for you.
Let's call ours "office".
Since this is our first and for now final end device we want to register we simply click the "Register end device" button, without changing the “After registration” option.
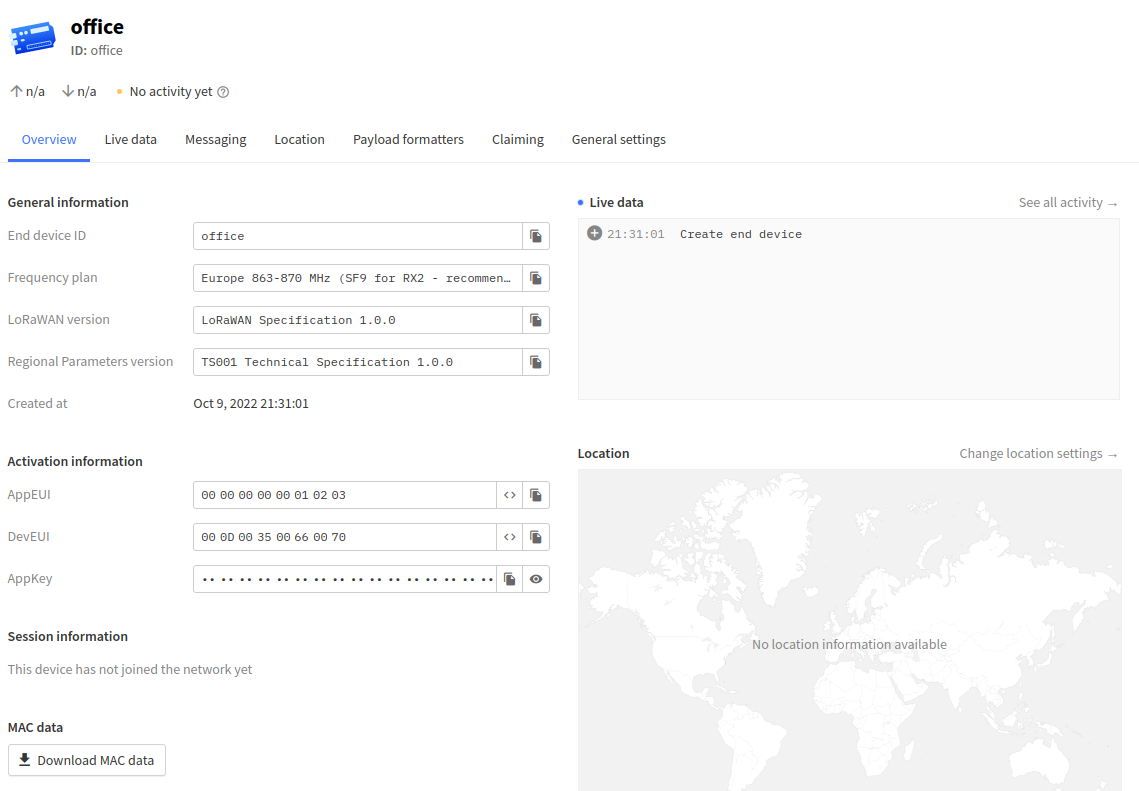
On the TTN web site you will be presented with an overview page for the new end device. It has not made any contact yet because we have not yet saved and activated our settings. Let's do that now by sending the commands AAT1 Save and AAT1 Reset to the terminal. The save command takes a few seconds to execute. You'll know that it's done when you see the ok reply.
As a bunus I'll give you one more setting to change. Per default the orange warning LED will light up when the CO2 level exceeds 800 ppm, which is a reasonable level I think. The red warning LED will light up at 1000 ppm, which is rather low and very close to the 800 ppm level. Therefore I change the red warning level to 1200 ppm on all my devices. You do that with the command DEV+CRITERIA_H=1200 .
And finally it's time to send the DEV+DTX_START command to resume normal operation.
Patience
Patience is key. Several things are happening now, simultaneously. If you look at the terminal you may see something like this, for quite some time.
Send join request
JOIN_NOT_ACCEPT
Send join request
Send join request
Send join request
Send join request
Send join request
Send join request
Send join request
Send join request
Send join request
Send join request
Send join request
Send join request
Send join request
Send join request
JOIN_NOT_ACCEPT
Send join request
Send join request
Send join request
Send join request
Send join request
Send join request
Send join request
Send join request
Send join request
Send join request
Send join request
Send join request
Send join request
Send join request
JOIN_NOT_ACCEPT
Send join request
Send join request
And if you click on the "Live data" field on the TTN web page you could see something like this:

Eventually you will see the much anticipated message JOIN_ACCEPT appear in the terminal.
That means that your device is accepted by the network and it can now start sending data.
Soon you should see something like the top line of the screenshot above.
You can view the details of each and every line in this list by clicking on it.
The most interesting line we see here is the "Forward uplink data message".
That's the line with the actual payload.
In this case the payload is:
01 09 81 12 1D 04 97
The 01 means we are listening to an LS-111P, as expected.
Then 09 and 81 are the hexadecimal values for the temperature, times 100.
If we decode that it will result in 24.33 °C.
Next 12 1D is the hexadecimal representation of the humidity, times 100.
If we translate that to decimal it will give us 46.37 %.
Finally 04 97 is the hexadecimal value of ..... the CO2 value of course.
After conversion it will give us the rather high value of 1175 ppm.
It appears I definitely need to ventilate.
This proves that it is working. But we're not there yet. We can read the data from the TTN website, but we have to do some manual decoding to get the results. This is not ideal. There is some more work to be done. The ultimate goal is that the information is sent to us through MQTT.
Processing The Raw Payload Data
From your applications console select "End devices" in the left column and then select the device you want to configure. Let's assume you only have one device, so it should not be too difficult to choose the right one. Click on the line containing the device and you will see an overview of that device. On the top row of that overview you should be able to see "Payload formatters". Click on it and you will see a drop down menu called "Formatter type". Select "Custom Javascript formatter" and you should get a page similar to the one below.
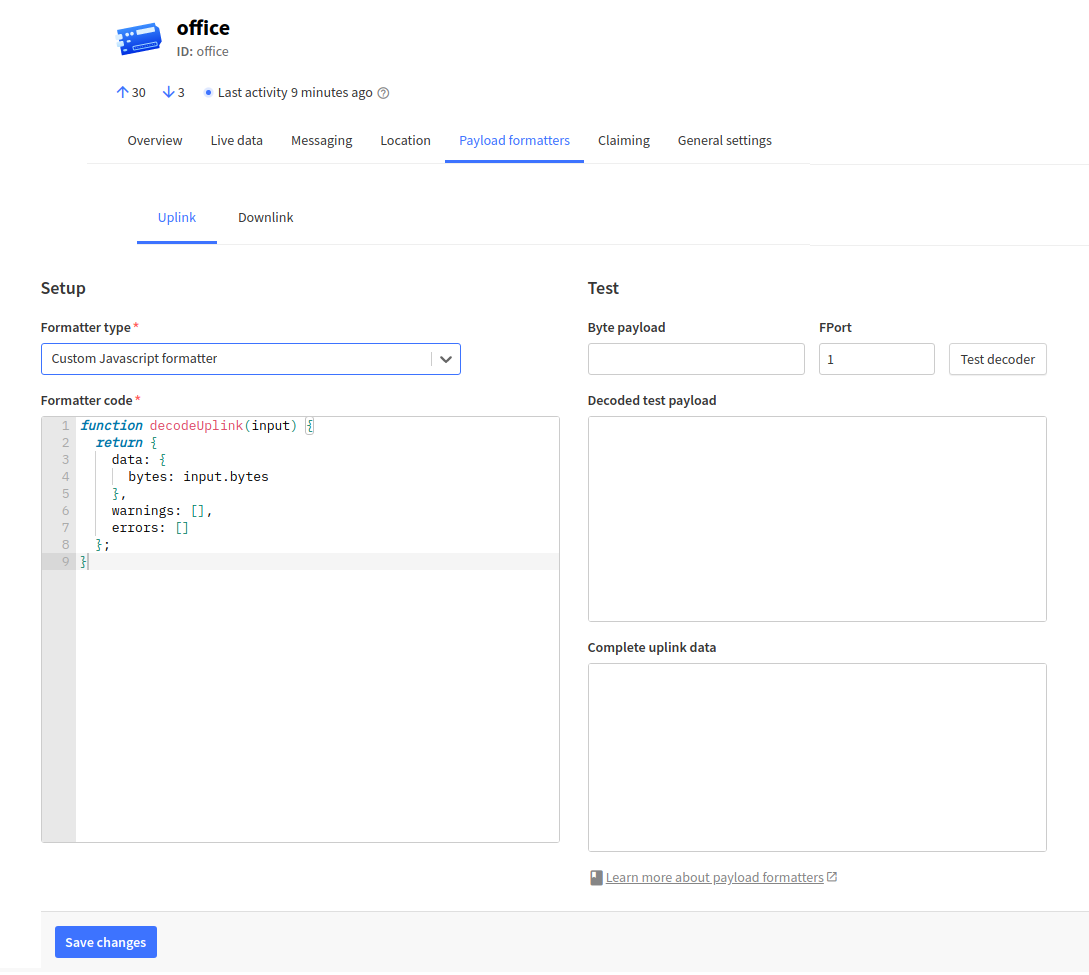
The big box on the left already contains a little bit of Javascript. Simply erase that and copy/paste the code below back into that box.
function decodeUplink(input) {
  if (input.bytes[0] == 1) {
    devtype = "LS-111P";
  } else {
    devtype = "?";
  }

  json = {
    data: {
      values: {devicetype: devtype,
      temperature: (input.bytes[1] * 256 + input.bytes[2]) / 100,
      humidity: (input.bytes[3] * 256 + input.bytes[4]) / 100,
      co2: input.bytes[5] * 256 + input.bytes[6]}
    }
  };
  return json
}
Then click the "Save changes" button on the bottom of the page.
Now you can test the payload formatting script by pasting the payload we have seen above into the payload box and then click the "Test decoder" button. And what do you know, we get exactly the same results as were calculated manually.
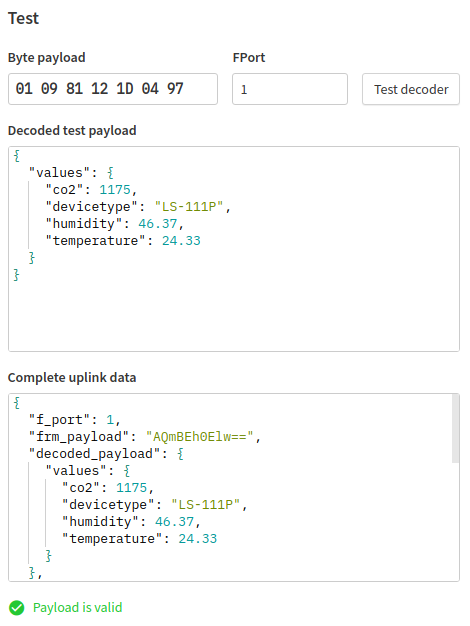
From now on, when you inspect the live data in the console, you will be able to see readable representations of the payload data.
But that still is not what we want.
We want this data to be sent to us via MQTT.
So let's make our final configuration.
On the left side of the console click the "Integrations" link.
A drop down menu appears and from that you select "MQTT".
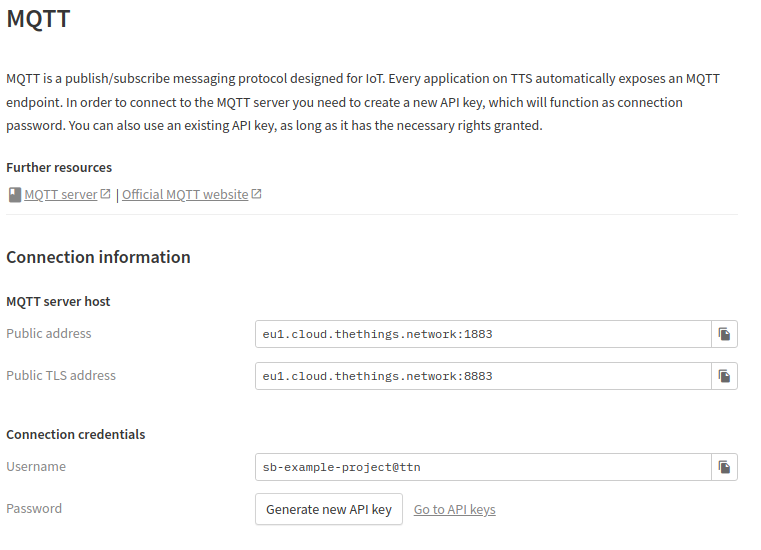
Here you can enter your own MQTT server information if you want to.
But you can also leave most of it as is, and use TTN's MQTT server instead.
It's up to you to decide which way you want to go.
For now we're going to use the TTN's server.
All we need to do is to generate a token, the rest is already filled in.
Click on "Generate new API key" and a new token is generated for you.
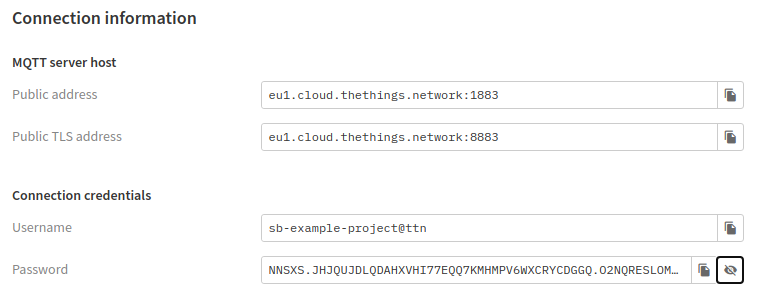
Copy/paste this token somewhere safe.
Once you leave this page there is no way to get a chance to see or copy the token again.
If you lose your token, simply create a new one here.
But that means that all your MQTT clients which use the TTN MQTT server will have to be updated.
Final Proof
And now for the moment of truth.
Let's see if we can subscribe to the server using the mosquitto MQTT client.
The bold text in the terminal output below shows you how to subscribe to the server.
Of course, the username (the part behind the -u parameter) and the password (the part behind the -P parameter) should be set to your specific values.
And depending on what part of the world you are living in, you may have to enter a different server address too (the -h parameter).
B.T.W. The password is the same as the token you have just generated.
I have made mine a bit shorter, otherwise the output would be rather wide.
For the same reason I have truncated the output message.
Normally the terminal width would do that for you.
After you enter the command you should wait for the first update to arrive, which should normally be within about 10 minutes.
mosquitto_sub -h eu1.cloud.thethings.network -p 8883 -u "sb-example-project@ttn" -P "NNSXS.......L5IV6PQ" -t "v3/sb-example-project@ttn/devices/office/up"
{"end_device_ids":{"device_id":"office","application_ids":{"application_id":"sb-example-project"},
"dev_eui":"000D003500660070","join_eui":"0000000000010203","dev_addr":"260B1A90"},"correlation_ids
":["as:up:01GF1X51VHPXA119JQTF203NHR","gs:conn:01GEF2BRDQ9SWS21N82702TESY","gs:up:host:01GEF2BREBM
YCZYGT3NDPR02Y0","gs:uplink:01GF1X51N2X7BKJTCF0FFZ6J2C","ns:uplink:01GF1X51N3YG3SQ6956FFT9G31","rp
c:/ttn.lorawan.v3.GsNs/HandleUplink:01GF1X51N31PH72YV2WP5BCSB7","rpc:/ttn.lorawan.v3.NsAs/HandleUp
link:01GF1X51VG27TEBXNR7HHWPCRM"],"received_at":"2022-10-10T21:34:57.905000223Z","uplink_message":
{"session_key_id":"AYPDyxBklWO4FgiKfEzJLA==","f_port":2,"f_cnt":1,"frm_payload":"AQijE/cDyQ==","de
coded_payload":{"values":{"co2":969,"devicetype":"LS-111P","humidity":51.11,"temperature":22.11}},
"rx_metadata":[{"gateway_ids":{"gateway_id":"aa555a0000100023","eui":"AA555A0000100023"},"time":"2
022-10-10T21:34:57.640170Z","timestamp":544013444,"rssi":-117,"channel_rssi":-117,"snr":-17.25,"up
link_token":"Ch4KHAoQYWE1NTVhMDAwMDEwMDAyMxIIqlVaAAAQACMQhPmzgwIaDAiBoJKaBhCu7/zMAiCgx+nN6tOQAQ=="
,"channel_index":7,"received_at":"2022-10-10T21:34:57.656175640Z"},{"gateway_ids":{"gateway_id":"a
a555a0000100024","eui":"AA555A0000100024"},"time":"2022-10-10T21:34:57.629385Z","timestamp":366625
9716,"rssi":-110,"channel_rssi":-110,"snr":-14.25,"uplink_token":"Ch4KHAoQYWE1NTVhMDAwMDEwMDAyNBII
qlVaAAAQACQQhN6a1A0aDAiBoJKaBhDjjprNAiCgz+7w2bGQAQ==","channel_index":7,"received_at":"2022-10-10T
21:34:57.659610151Z"},{"gateway_ids":{"gateway_id":"sb-projects","eui":"34FA40FFFE138D15"},"time":
"2022-10-10T21:34:27.252893Z","timestamp":3831438884,"rssi":-62,"channel_rssi":-62,"snr":9.2,"loca
tion":{"latitude":51.609365,"longitude":5.151907,"source":"SOURCE_REGISTRY"},"uplink_token":"ChkKF
woLc2ItcHJvamVjdHMSCDT6QP/+E40VEKS8/KIOGgwIgaCSmgYQ1Jax3QIgoPm2nMG2kAE=","channel_index":7,"receiv
ed_at":"2022-10-10T21:34:57.732711764Z"}],"settings":{"data_rate":{"lora":{"bandwidth":125000,"spr
eading_factor":12,"coding_rate":"4/5"}},"frequency":"867900000","timestamp":544013444,"time":"2022
-10-10T21:34:57.640170Z"},"received_at":"2022-10-10T21:34:57.699465801Z","consumed_airtime":"1.318
912s","network_ids":{"net_id":"000013","tenant_id":"ttn","cluster_id":"eu1","cluster_address":"eu1
.cloud.thethings.network"}}
I understand that the output might look a bit overwhelming. It's all formatted as a JSON string. A lot of information is included here. There's even information about the gateway that was used to get your data across. You may have great difficulty reading this garbage. But programs like Node Red for instance have no problems at all with it. If you look carefully you'll see the payload somewhere in the great mess.
On Linux there is a tool which can be used to make a bit more sense out of this mess(age).
It is usually not installed yet, so you'll have to install it yourself.
The tool is simply called jq.
Copy the entire message to a text file and save it.
Then enter the command in bold in the terminal output below and you should see a neatly formatted JSON output.
Make sure to include the dot behind the jq command.
cat message.json | jq .
{
  "end_device_ids": {
    "device_id": "office",
    "application_ids": {
      "application_id": "sb-example-project"
    },
    "dev_eui": "000D003500660070",
    "join_eui": "0000000000010203",
    "dev_addr": "260B1A90"
  },
  "correlation_ids": [
    "as:up:01GF1X51VHPXA119JQTF203NHR",
    "gs:conn:01GEF2BRDQ9SWS21N82702TESY",
    "gs:up:host:01GEF2BREBMYCZYGT3NDPR02Y0",
    "gs:uplink:01GF1X51N2X7BKJTCF0FFZ6J2C",
    "ns:uplink:01GF1X51N3YG3SQ6956FFT9G31",
    "rpc:/ttn.lorawan.v3.GsNs/HandleUplink:01GF1X51N31PH72YV2WP5BCSB7",
    "rpc:/ttn.lorawan.v3.NsAs/HandleUplink:01GF1X51VG27TEBXNR7HHWPCRM"
  ],
  "received_at": "2022-10-10T21:34:57.905000223Z",
  "uplink_message": {
    "session_key_id": "AYPDyxBklWO4FgiKfEzJLA==",
    "f_port": 2,
    "f_cnt": 1,
    "frm_payload": "AQijE/cDyQ==",
    decoded_payload": {
      "values": {
        "co2": 969,
        "devicetype": "LS-111P",
        "humidity": 51.11,
        "temperature": 22.11
      }
    },
    "rx_metadata": [
      {
        "gateway_ids": {
          "gateway_id": "aa555a0000100023",
          "eui": "AA555A0000100023"
        },
        "time": "2022-10-10T21:34:57.640170Z",
        "timestamp": 544013444,
        "rssi": -117,
        "channel_rssi": -117,
        "snr": -17.25,
        "uplink_token": "Ch4KHAo.....Cgx+nN6tOQAQ==",
        "channel_index": 7,
        "received_at": "2022-10-10T21:34:57.656175640Z"
      },
      {
        "gateway_ids": {
          "gateway_id": "aa555a0000100024",
          "eui": "AA555A0000100024"
        },
        "time": "2022-10-10T21:34:57.629385Z",
        "timestamp": 3666259716,
        "rssi": -110,
        "channel_rssi": -110,
        "snr": -14.25,
        "uplink_token": "Ch4KHAo.....Cgx+nN6tOQAQ==",
        "channel_index": 7,
        "received_at": "2022-10-10T21:34:57.659610151Z"
      },
      {
        "gateway_ids": {
          "gateway_id": "sb-projects",
          "eui": "34FA40FFFE138D15"
        },
        "time": "2022-10-10T21:34:27.252893Z",
        "timestamp": 3831438884,
        "rssi": -62,
        "channel_rssi": -62,
        "snr": 9.2,
        "location": {
          "latitude": 51.609365,
          "longitude": 5.151907,
          "source": "SOURCE_REGISTRY"
        },
        "uplink_token": "Ch4KHAo.....Cgx+nN6tOQAQ==",
        "channel_index": 7,
        "received_at": "2022-10-10T21:34:57.732711764Z"
      }
    ],
    "settings": {
      "data_rate": {
        "lora": {
          "bandwidth": 125000,
          "spreading_factor": 12,
          "coding_rate": "4/5"
        }
      },
      "frequency": "867900000",
      "timestamp": 544013444,
      "time": "2022-10-10T21:34:57.640170Z"
    },
    "received_at": "2022-10-10T21:34:57.699465801Z",
    "consumed_airtime": "1.318912s",
    "network_ids": {
      "net_id": "000013",
      "tenant_id": "ttn",
      "cluster_id": "eu1",
      "cluster_address": "eu1.cloud.thethings.network"
    }
  }
}
As a shortcut you can also give the command below. This will subscribe to the topic and filter the payload out of the rest of the mess(age), which makes the most important information easier to spot.
mosquitto_sub -h eu1.cloud.thethings.network -p 8883 -u "sb-example-project@ttn" -P "NNSXS.......L5IV6PQ" -t "v3/sb-example-project@ttn/devices/office/up | jq '.uplink_message.decoded_payload.values'"
{
  "co2": 969,
  "devicetype": "LS-111P",
  "humidity": 51.11,
  "temperature": 22.11
}
That's all there is to it. The rest is up to you.
Personally I use Node Red to visualise my measurements.
Only your imagination is the limit here.
Finally I want to repeat my previous warning here: Success greatly depends on TTN coverage in your area.

 Globalsat LS-111P AT Commands